
Overtrading is the habit of taking on more positions, more size, or more frequent trades than your plan and your account can support. It usually shows up as a slow bleed of commissions, wider losses, and decisions made to recover a bad day rather than to follow a process.
The fix is not more discipline in the abstract. It is a written limit on how much you trade, checked before you click, plus a short list of conditions that tell you to stop for the day or the week. Below you will find the signs, the causes, and a practical way to set that limit.
What overtrading actually looks like
Most people picture overtrading as a frantic day trader clicking through dozens of orders, and that is one version. Another is an investor who checks prices every hour and moves money between funds whenever headlines turn negative. Although they look different, both are the same behavior wearing different clothes: activity replacing a plan.
The clearest sign is that your trade count or position changes have risen while your results have not. If you are paying more in spreads, commissions, or taxes and your returns are flat or falling, the extra activity is costing you something and buying you nothing.
A second sign is that you cannot explain why you entered the last few trades. If the reason was boredom, a notification, a chat room, or the need to make back yesterday’s loss, the trade was not a decision; it was a reaction.
A third sign is physical. Shortened sleep, checking your phone at meals, irritability after a red day, and a nagging sense that you are behind are common among people who trade too much. These are not moral failings. They are feedback from a system that is running hotter than it was designed to.
Why overtrading happens
Overtrading is not mainly a knowledge problem, because most people who do it can describe sound risk rules. The gap is between knowing the rule and following it under pressure.
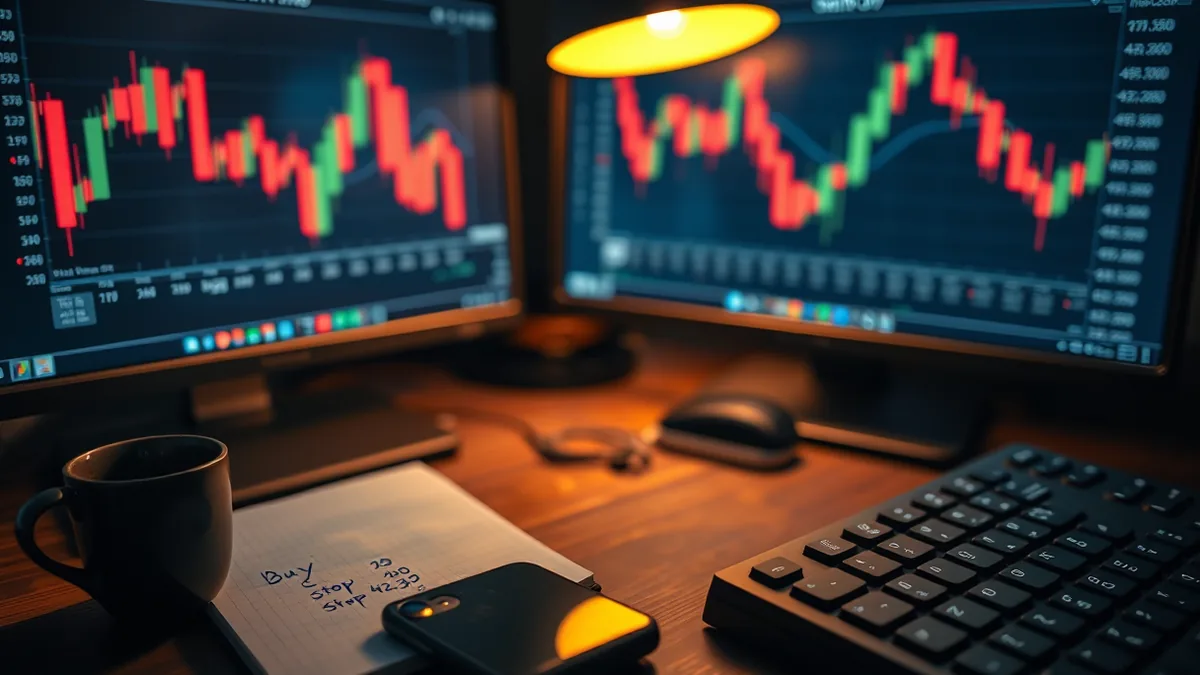
One cause is variable reward, since markets deliver wins and losses on an unpredictable schedule—which is exactly the pattern that makes a behavior stick. A trade that pays off after a string of losses teaches the brain that one more attempt might work, so the lesson is emotional, not statistical.
A second cause is loss aversion. A loss hurts more than an equal gain feels good, so the urge to trade again to erase it is strong. This is why overtrading often clusters after a bad trade rather than after a good one.
A third cause is social comparison. Screenshots of large wins travel faster than screenshots of a slow year. If your reference group is a feed of highlight reels, your own normal results start to look like failure, and the response is to trade more.
A fourth cause is unclear ownership of the decision, which happens when a position is opened because a friend mentioned it, a newsletter suggested it, or an algorithm flagged it. In each case, the person who bears the loss did not really choose the trade, and that distance makes it easier to take the next one.
None of this means you are irrational; it means the environment is built to reward action, while your default settings are not a strategy.
Warning signs for short-term traders
If your holding period runs from weeks to about six months, you’re typically a swing trader; your main risk from overtrading is execution cost and decision fatigue. Spreads, commissions, slippage, and short-term capital gains taxes compound against you with every extra round trip.
Watch for these signals. You are trading more than your written plan allows, or you are adding to losers without a predefined level. You are changing your stop after entry, or taking setups that are close to your criteria but not quite there. You are trading during hours you said you would not, or checking profit and loss during the session and letting that number drive the next order.
A practical test is to compare your trade log against your plan for the last twenty trades. Count the ones that followed your rules and the ones that did not. If the rule-breakers are a meaningful share of the total, the problem is not your analysis. It is the gap between your plan and your behavior.
Another test is to look at your best and worst days. If the worst days contain far more trades than the best ones, you are likely overtrading when you are losing. That pattern is common and it is expensive.
Warning signs for longer-term investors
If your horizon is a year or longer, overtrading looks quieter. It shows up as portfolio churn: selling a fund after a bad quarter, buying a theme after a strong run, and repeating the cycle every few months.
Watch for these signals. You are frequently changing your asset allocation without a change in your goals. You are reacting to headlines within a day or two of reading them. You are holding more positions than you can describe from memory. You are buying products you cannot explain in one sentence. You are checking your portfolio daily even though your plan is annual.
For investors, the cost is less about commissions and more about behavior. Selling after a decline locks in the loss and removes the chance to participate in a recovery. Buying after a run-up often means paying a higher price for the same asset. The tax treatment on short-term gains may differ from that of long-term holders.
A useful check is to write down the reason for your last five portfolio changes. If the reasons are mostly about recent price movement rather than your goals, risk tolerance, or time horizon, you are likely trading your portfolio instead of managing it.
A simple fix: a hard trade limit
The most effective single rule is a hard cap on activity, set in advance and written down. It works because it removes the decision from the moment when your judgment is worst.
For traders, the cap can be a maximum number of trades per day or per week, and a maximum number of losing trades before you stop. For example, you might decide that after a certain number of losing trades in a session, you close the platform and review your log. The number is yours to choose, but it must be small enough that you can actually follow it on a bad day.
For investors, the cap can be a maximum number of portfolio changes per quarter, or a rule that any change requires a written reason tied to a goal. A common version is a cooling-off period: if you want to sell after a sharp drop, you wait and revisit the decision with your plan in front of you.
The limit only works if it is specific and visible, because “Trade less” is not a rule. “No more than a few trades per day, and stop after consecutive losses” is a rule, so put it where you place orders and read it before you start, not after.
A second layer is a pre-trade checklist with three or four items: does this trade match my plan, is my size within my limit, what is my exit if I am wrong, and am I trading to follow the plan or to fix a feeling. If any answer is no, you do not take the trade.
A third layer is a regular review, when you count your trades, your rule breaks, and your costs. The goal is not to feel bad about the number, but to see whether the limit is set at the right level. If you break it every week, the limit is too loose or the plan is too vague; however, if you never come close, it may be too tight to matter.
What to expect when you cut back
Fewer trades will feel strange at first. You will have more time, more uncertainty, and fewer chances to feel the small reward of a click. That discomfort is normal and it fades as your process becomes the source of feedback instead of the market.
One counter-argument is worth taking seriously: some strategies genuinely require frequent activity, and a hard cap could interfere with a tested edge. If your strategy has a documented, repeatable reason for high turnover and the costs are already included in your expectations, a blanket limit may not fit. In that case, cap risk per trade and total daily loss instead of trade count.
Another counter-argument is that a limit can become an excuse to stop thinking. A cap is a floor on discipline, not a substitute for judgment. You still need to know why you are in a position and what would make you leave.
The honest expectation is that cutting overtrading will not turn a losing strategy into a winning one. It will reduce costs, reduce emotional decision-making, and give you cleaner data about whether your approach actually works. That is the point.
Conclusion: make the limit before you need it
Overtrading is easier to prevent than to stop in the moment. The signs are visible in your logs, your costs, and your sleep long before they show up in a blown account. The causes are ordinary human wiring, not a character flaw. The fix is a written cap on activity, a short checklist, and a weekly review that tells you whether the cap is working.
Set the number when you are calm, then follow it when you are not. If you cannot follow it, make it smaller until you can, then rebuild from there.
- Loss Aversion: Why Cutting Losers Feels So Hard
- Discipline and Patience: The Trader’s Most Underrated Skills
- FOMO and Panic: Controlling Emotions in Trading
Frequently Asked Questions
How many trades per day is considered overtrading?
There is no universal number. Overtrading is defined relative to your plan and your costs, not a fixed count. A better test is whether extra trades follow your rules and improve your results after fees and taxes.
Is overtrading a form of gambling?
It can share features with gambling, such as variable rewards and chasing losses, but the label matters less than the behavior. If you are trading to recover a loss or to feel active rather than to follow a plan, the risk profile is similar.
Can overtrading be fixed with discipline alone?
Discipline helps, but rules and environment changes usually matter more. A hard trade limit, a pre-trade checklist, and a cooling-off period remove decisions from the moments when judgment is weakest.
How does overtrading affect long-term investors?
For investors, overtrading usually appears as frequent portfolio changes after headlines or short-term performance. The main costs are locked-in losses, buying after run-ups, higher taxes on short-term gains, and drifting away from a plan tied to goals.
What should I track to see if I am overtrading?
Track trade count, rule breaks, total costs including spreads and commissions, and the reasons for each change. Compare losing periods with winning periods. If activity rises when results fall, you have a useful signal to tighten your limit.
AI Notice: This article was created wholly or predominantly with the assistance of artificial intelligence and was published without human editorial review.
This article is for general information only and does not constitute investment advice. Always do your own research before making trading decisions.