Fibonacci Retracements: What They Can and Cannot Tell You

Fibonacci retracements show where a pullback may pause, not where price must turn. Learn their real limits and how to combine them with market structure.
Fibonacci retracements show where a pullback may pause, not where price must turn. Learn their real limits and how to combine them with market structure.
How large, mid and small cap stocks differ in volatility, liquidity and index membership, with separate notes for traders and long-term investors.
Calls and puts explained for retail traders and investors: how option contracts work, payoff profiles at expiry, and the risks of buying and selling them.
Learn how to calculate free cash flow, why it differs from net income, and the warning signs that cash flow statements reveal about a company’s real value.
How implied volatility, gap risk and post-earnings drift shape earnings trades. Worked examples for traders and investors, plus edge cases.
Learn how Bollinger Bands squeeze setups and band walks work, the signals they give, and the risks traders and investors should weigh before acting.
T+1 settlement explained for US and UK investors: when trades settle, when cash becomes free to withdraw, and how to avoid good-faith violations.
Leveraged and inverse ETFs reset daily, so volatility erodes returns even when the index ends flat. See the math, plus trader and investor views.
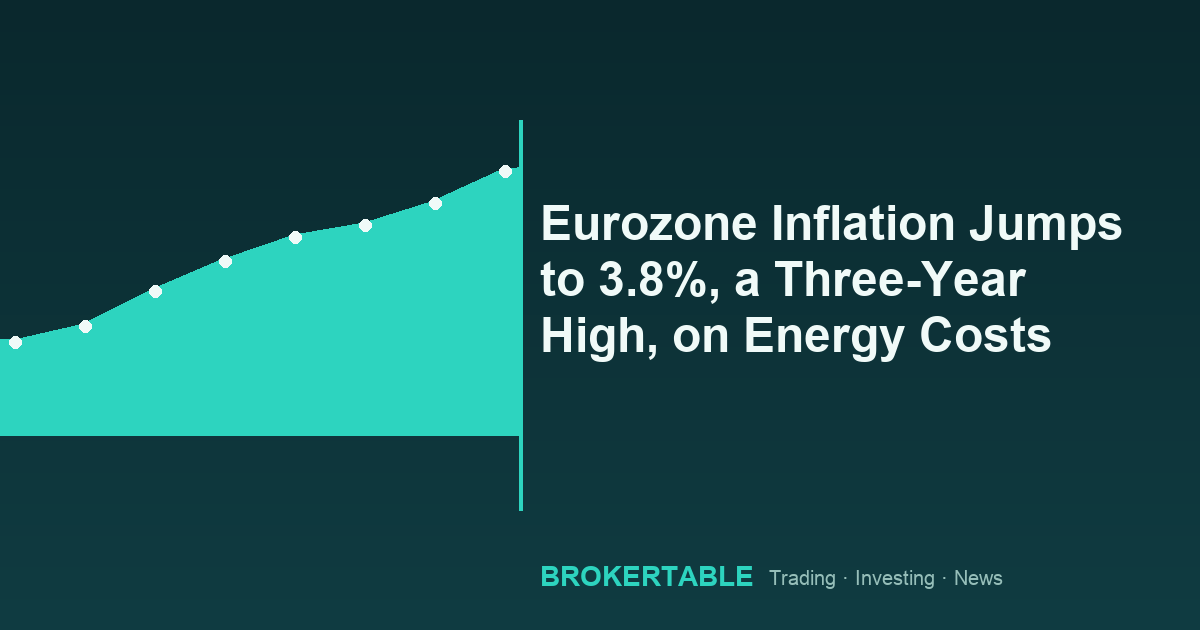
Eurozone inflation rose to 3.8% in September 2026, a three-year high, Eurostat’s flash estimate shows, driven by an 18.8% annual energy price surge.
A low P/E ratio can mean a bargain or a value trap. Learn how earnings quality, comparability and risk shape what the number really tells you.